Following my article The Amazing Story Of AppEngine And The Two Orders Of Magnitude, I’ve made some initial adjustments to Syyncc ‘s performance settings, and a minor code tweak.
Instances
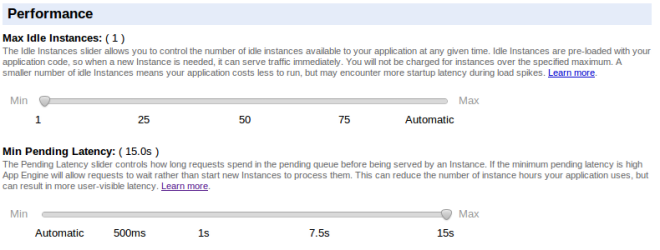
I made the following change to Syyncc’s performance settings today:

I’ve set the Max Idle Instances to 1, and Min Pending Latency to 15 seconds. ie: hang it all, don’t start more instances unless the sky is falling in.
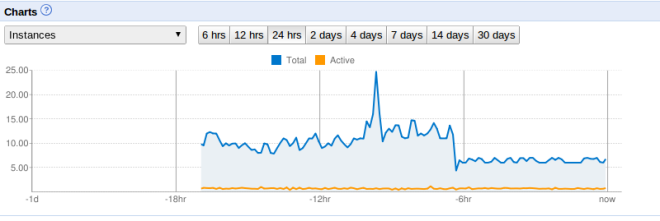
Syyncc’s site still seems responsive enough, and the app itself is working as before, I can’t detect any functional difference. But what’s important is that the average instance count has dropped significantly:

It’s dropped to 4 or 5 instances average, rather than 10 to 15 that it’s normally at. Not bad for shoving a couple of sliders around! And that’s without what will be necessary code changes, to stop the behaviour where the 50 tasks are scheduled concurrently once every 2 mins. That leads to a spike in activity, then nothing for most of the time, and is very likely the cause of excess idle instances. That’s all detailed in the previous post, linked at the top.
Given that the impact from the performance tuning is obvious, I’ll go ahead with refactoring the bursty scheduling code in the next few days, and post the results of that.
A bit more detail:

Not quite good enough (I want to get down to under 2 average), but much better.
Datastore Reads
You’ll recall from the previous article I had the horrible code full of fetches with offsets. I’ve replaced it with this:
    def SetAllNextChecks(cls):
        monitor_query = SSMonitorBase.all().filter("enabled", True)
        lopcount = 0
        for monitor in monitor_query:
            if not monitor.nextcheck:
                monitor.nextcheck = datetime.today() - timedelta(days=5)
                monitor.put()
            lopcount += 1
        logging.debug("SetAllNextChecks processed %s monitors" % lopcount)
    SetAllNextChecks = classmethod(SetAllNextChecks)
So that’s a simple iteration through the query that should behave much better; the debug line says
D2011-09-04 23:19:24.189 SetAllNextChecks processed 1403 monitors
and I’m fairly sure that this is actually accurate (ie: it’s not actually touching over 100,000 objects!)
There’s no way to tell if it’s helping at the moment, Datastore Reads are only surfaced in the billing, and the billing lags a few days behind. So, I’ll report back midweek or so with results of this change.
It’s a start
That’s it for now. Some preliminary success, but I’ve got a way to go. Stay tuned for the next update in a few days.
Wait to see your billing results….
[…] Emlyn's Blog – Downshifting, Creating, Ranting « Syyncc, AppEngine and Me AppEngine Tuning #1 […]
You can (and should!) use [0] AppStats to look at your RPCs to find out if you did indeed solve the problem. Doing so should show the previous behavior pretty clearly.
[0] http://code.google.com/appengine/docs/python/tools/appstats.html
I didn’t know about AppStats, that’s gold, thanks!
But for this issue, it’s not going to show me what I want to see, is it? If I do a fetch like
foo.fetch(10, 20000)
I’ll see one rpc call, but in the datastore there’ll be 20010 reads which are invisible to me (and which are the problem). Is that not the case?
Yes and no. You can’t actually see how many reads are done, but you _can_ see the query being executed, and how long it took to run. Example output for a query that fetches 150+1 entities:
@26ms datastore_v3.RunQuery real=7393ms api=1396ms
Request: Query<app_='socghop', compile_=True, composite_index_=[], count_=151, filter_=[Query_Filter, Query_Filter], …>
Response: QueryResult<compiled_cursor_=CompiledCursor<position_=[CompiledCursor_Position]>, …>
The fact that the api time is above 10 seconds should tell you that there’s a lot of entities being fetched and that you should make sure that this query is doing what you’re expecting it to be doing. Your example would show up as a query like this happening _multiple times_, something that should definitely set of alarm bells :).
That might be true, the particular request overall took a long time to run, datastore response time in that bad section could have been part of it.
You can further optimize things in that loop by accumulating the results and storing them in a single batch put operation. And instead of using iterators, if you fetch in a batch, you’ll further reduce RPCs. Sverre’s suggestion of using appstats is a good one.
Absolutely, a fetch using cursors would be better. However, as I’ve said in the articles, the proper fix is to remove this code altogether.
What I’ve done here is the simplest, cleanest little bit of code I can which should show the difference clearly between the old situation and the new one. Think of it more as testing an hypothesis, rather than as a final fix of the code.
As to a batch put, that’s probably worth looking at. The new billing says that I’ll be paying for datastore writes too; not much, but it’s there. So they probably warrant optimisation. However, they’re a rounding error at the moment, bigger fish to fry!
Can’t you query for only entities that are enabled and have nextcheck = None?
No, new ones will have no nextcheck, rather than a nextcheck set to None (I think).
I haven’t read the code for a while, but I think db.Model will store a None for all properties unless you’ve removed the property from your model or are using an Expando. You get charged a read for every entity that matches the query, so optimizing the query to return fewer results should save you money.
[…] point7 Emlyn's Blog – Downshifting, Creating, Ranting « AppEngine Tuning #1 […]
i use SQLite inside GAE, dont use datastore
How can you do that in production?
[…] Emlyn O’Regan has written a really fine article explaining in great detail his experiences tuning his application for the new pricing model. He has also followed this article up with AppEngine Tuning #1. […]