Distributed Promises for AppEngine

PromiseThis post is a plea for help. I’ve made something pretty cool, in a commercial context, that’s small and contained and useful and which I want to open source. I’ve got no experience in successfully creating open sourced code that other people might want to interact with, so I’m looking for guidance from someone who does, particularly in the Python and/or AppEngine communities.


AppEngine is a great platform, one I’ve been working in now, using Python, for a couple of years.

One of the ongoing annoyances for me has been the low-level nature of the abstractions available for distributed programming, particularly using task queues to kick off background tasks (which might want to kick off more background tasks and etc).

At the most basic, you can create tasks on a queue. The queue is processed, the task runs eventually. The task is a web handler (a “get” handler iirc). Simple, but it’s messy to set up if you want to do complex things, lots of boilerplate, lots of messing around with routes and so on.

Then there’s the excellent deferred library. It allows you to kick off a function with some arguments in a task, but hiding all of the task queue messiness. It makes tasks highly useful and usable. But there are still niggles.

Firstly, deferred functions are passed by name. Actually, it’s more complex than this; deferred takes a callable, which might be an object (must be picklable, is pickled), or a function (passed by name for the most part I think, maybe something else going on with built in functions). But in any case we have the following restrictions in the doc:

The following callables can NOT be used as tasks:
1) Nested functions or closures
2) Nested classes or objects of them
3) Lambda functions
4) Static methods

ie: you can’t use really interesting stuff.

The second problem is that you launch a process, but then what? Does it ever execute? How do you know when it’s complete? How can you compose these calls?

As a higher level alternative to using deferred, I’ve made a library that provides distributed promises.

It lets you do things like this:


def MyLongRunningFunction(resolve):
try:
# we're in a separate task. Do something long running!
# eventually call resolve(result), with whatever result you made
except Exception, ex:
resolve(ex)
def MyFunctionToRunAfterThat(result):
try:
value = result.value
# we now have the value passed to resolve. Do something with it.
except Exception, ex:
# if resolve() was passed an exception, it'll arrive here when
# we access result.value
logging.exception("failure running long running thing")
PromiseSpace().when(MyLongRunningFunction).then(MyFunctionToRunAfterThat)

The interesting thing here is that both the functions are run in (separate) background tasks. If the first one times out, the second one will receive a timeout error as the result.

You’ll recognise promises more or less from the javascript world. These are similar, but structured a little differently.

Javascript’s promises are used for handling an asynchronous environment inside a single process. So you can kick off something asynchronous, and have the handler for that be a closure over the resolve method, meaning you can signal the job is done in a finished handler, without needing to “return” from the originating function.

For python on appengine, if you want to manage asynchronous behaviour inside a single process, try ndb tasklets.

My distributed promises for appengine are instead for managing distributed processing; that is, algorithms coordination multiple tasks to do something.

The function you pass to your promise (via when, then, etc) will run in a separate task, and can signal it is done by calling resolve() which will trigger further tasks (eg: as above) if necessary.

Also, to make promises really work and be interesting, I’ve included the ability to pass inner functions and closures and so on through to the promises. So while defer takes only callables that are picklable or referenceable by name, promises take functions (must be functions, not other callables) which are completely serialised with their entire closure context as necessary, and reconstructed in the task in which they will run. So you can do things like this:


def DoABigThing(aListOfNumbers, callWhenSucceededF, callWhenFailedF):
def DoTheThing(resolve, initialValue):
theSum = sum(aListOfNumbers) + initialValue
theSum += # also get some stuff from a webservice or datastore or something else slow?
resolve(theSum)
def DoneTheThing(result):
try:
callWhenSucceededF(result.value)
except Exception, ex:
callWhenFailedF(ex)
PromiseSpace().when(DoTheThing, 47).then(DoneTheThing)

view raw

gistfile1.py

hosted with ❤ by GitHub

Note the functions are referring to names from outside their own scope. Full closures are allowed. Also you can pass lambda functions.

The when() function returns a promise. The then() function returns a promise. There’s an all() function which also returns a promise (as well as variations such as allwhen and allthen). These functions are completely chainable.

The all() functions allow you to do something when a bunch of other things finish, ie:

promiseSpace.all([promises...]).then(somethingfinal)

Python has great exception handling, so I’ve dispensed with Javascript’s separate resolve and reject methods; to reject, just pass an exception to resolve. Also dispensed with are separate success / fail handlers; instead you get a result object with a value property, which throws the exception if the result was actually an exception.

Here’s a more red-blooded example of a function for mapping over the datastore, and example of using that to make a count function, and an example of calling that function:


# This is a generic map function for the datastore.
# Suitable for passing to the PromiseSpace.when() method.
# outerresolve: this function is called when the mapping is complete, with the full result.
# promiseSpace: a promise space, to be used for making promises.
# dsQuery: an ndb datastore query.
# mapF: an optional map function. Takes an object or key (depending on keyOnly) and returns something.
# reduceF: an optional reduce function. Takes a list of results of mapping and a previous return value
# from reduceF, and returns a new value
# keyOnly: determines whether the queries fetch objects or just keys
# pageSize: size of the pages fetched from the query
# returns:
# if no mapF, no reduceF:
# returns a list of items or keys fetched from the query. Be careful not to get too many!
# if has mapF but no reduceF:
# returns a list of results from mapF. Be careful not to get too many!
# if has no mapF, but has reduceF:
# returns last result returned by calling reduceF on lists of keys/items
# if has both mapF and reduceF:
# returns last result returned by calling reduceF on lists of mapF results
def MapDS(outerresolve, promiseSpace, dsQuery, mapF = None, reduceF = None, keyOnly = False, pageSize = 100):
def ProcessPage(resolve, cumulativeResult, cursor):
try:
if cursor:
litems, lnextCursor, lmore = dsQuery.fetch_page(pageSize, start_cursor = cursor, keys_only = keyOnly)
else:
litems, lnextCursor, lmore = dsQuery.fetch_page(pageSize, keys_only = keyOnly)
llocalResult = (mapF(litem) if mapF else litem for litem in litems)
if reduceF:
resolve((reduceF(llocalResult, cumulativeResult), lmore, lnextCursor))
else:
if cumulativeResult is None:
cumulativeResult = llocalResult
else:
cumulativeResult.extend(llocalResult)
resolve((cumulativeResult, lmore, lnextCursor))
except Exception, ex:
logging.exception("error in ProcessPage")
resolve(ex)
def NextPage(result):
try:
lcumulativeResult, lmore, lcursor = result.value
if not lmore:
outerresolve(lcumulativeResult)
else:
lpromise = promiseSpace.when(ProcessPage, lcumulativeResult, lcursor)
lpromise.then(NextPage)
except Exception, ex:
logging.exception("error in NextPage")
outerresolve(ex)
lpromise = promiseSpace.when(ProcessPage, None, None)
lpromise.then(NextPage)
# This is a generic counting function, which can count arbitrarily large data sets.
# Suitable for passing to the PromiseSpace.when() method.
# outerresolve: this function is called when the counting is complete, with the count.
# promiseSpace: a promise space, to be used for making promises.
# dsQuery: an ndb datastore query to count elements of
# progressF: if present, is called periodically, with the subtotal.
def CountDS(outerresolve, promiseSpace, dsQuery, progressF = None):
def CountMap(itemkey):
return 1
def CountReduce(counts, subtotal):
result = (subtotal if subtotal else 0) + sum(counts)
progressF(result)
return result
return MapDS(outerresolve, promiseSpace, dsQuery, CountMap, CountReduce, True)
# An example of how you might use CountDS
class CountResult(ndb.Model):
countname = ndb.StringProperty()
result = ndb.IntegerProperty()
def Count(self, dsQuery)
def UpdateSelf(result):
try:
self = self.key.get() # must reload self, will be old serialised version.
self.result = result.value
self.put()
except Exception, ex:
logging.exception("Counting failed")
promiseSpace = PromiseSpace(countname)
promiseSpace.when(CountDS, dsQuery).then(UpdateSelf)
CountResult("MyNdbObjectCount", MyNdbObject.query()).put()

view raw

gistfile1.py

hosted with ❤ by GitHub

Start at the bottom and work upwards to see how a simple counting method is implemented.

There might be much better ways of writing this; I’m not especially good at using these promises yet!

So, in closing, if you can see some value in this and you could help me with how to best publish this code, please contact me.

Distributed Promises for AppEngine

gaedocstore: JSON Document Database Layer for ndb

In my professional life I’m working on a server side appengine based system whose next iteration needs to be really good at dealing with schema-less data; JSON objects, in practical terms. To that end I’ve thrown together a simple document database layer to sit on top of appengine’s ndb, in python.

Here’s the github repo: https://github.com/emlynoregan/gaedocstore

And here’s the doco as it currently exists in the repo, it should explain what I’m up to.

This library will no doubt change as begins to be used in earnest.

gaedocstore

gaedocstore is MIT licensed http://opensource.org/licenses/MIT

gaedocstore is a lightweight document database implementation that sits on top of ndb in google appengine.

Introduction

If you are using appengine for your platform, but you need to store arbitrary (data defined) entities, rather than pre-defined schema based entities, then gaedocstore can help.

gaedocstore takes arbitrary JSON object structures, and stores them to a single ndb datastore object called GDSDocument.

In ndb, JSON can simply be stored in a JSON property. Unfortunately that is a blob, and so unindexed. This library stores the bulk of the document in first class expando properties, which are indexed, and only resorts to JSON blobs where it can’t be helped (and where you are unlikely to want to search anyway).

gaedocstore also provides a method for denormalised linking of objects; that is, inserting one document into another based on a reference key, and keeping the inserted, denormalised copy up to date as the source document changes. Amongst other uses, this allows you to provide performant REST apis in which objects are decorated with related information, without the penalty of secondary lookups.

Simple Put

When JSON is stored to the document store, it is converted to a GDSDocument object (an Expando model subclass) as follows:

  • Say we are storing an object called Input.

  • Input must be a dictionary.

  • Input must include a key at minimum. If no key is provided, the put is rejected.

    • If the key already exists for a GDSDocument, then that object is updated using the new JSON.
    • With an update, you can indicate “Replace” or “Update” (default is Replace). Replace entirely replaces the existing entity. “Update” merges the entity with the existing stored entity, preferentially including information from the new JSON.
    • If the key doesn’t already exist, then a new GDSDocument is created for that key.
  • The top level dict is mapped to the GDSDocument (which is an expando).

  • The GDSDocument property structure is built recursively to match the JSON object structure.

    • Simple values become simple property values
    • Arrays of simple values become a repeated GenericProperty. ie: you can search on the contents.
    • Arrays which include dicts or arrays become JSON in a GDSJson object, which just hold “json”, a JsonProperty (nothing inside is indexed, or searchable)
    • Dictionaries become another GDSDocument
    • So nested dictionary fields are fully indexed and searchable, including where their values are lists of simple types, but anything inside a complex array is not.

eg:

ldictPerson = {
    "key": "897654",
    "type": "Person",
    "name": "Fred",
    "address": 
    {
        "addr1": "1 thing st",
        "city": "stuffville",
        "zipcode": 54321,
        "tags": ['some', 'tags']
    }
}

lperson = GDSDocument.ConstructFromDict(ldictPerson)
lperson.put()    

This will create a new person. If a GDSDocument with key “897654” already existed then this will overwrite it. If you’d like to instead merge over the top of an existing GDSDocument, you can use aReplace = False, eg:

    lperson = GDSDocument.ConstructFromDict(lperson, aReplace = False)

Simple Get

All GDSDocument objects have a top level key. Normal ndb.get is used to get objects by their key.

Querying

Normal ndb querying can be used on the GDSDocument entities. It is recommended that different types of data (eg Person, Address) are denoted using a top level attribute “type”. This is only a recommended convention however, and is in no way required.

You can query on properties in the GDSDocument, ie: properties from the original JSON.

Querying based on properties in nested dictionaries is fully supported.

eg: Say I store the following JSON:

{
    "key": "897654",
    "type": "Person",
    "name": "Fred",
    "address": 
    {
        "key": "1234567",
        "type": "Address",
        "addr1": "1 thing st",
        "city": "stuffville",
        "zipcode": 54321
    }
}

A query that would return potentially multiple objects including this one is:

GDSDocument.gql("WHERE address.zipcode = 54321").fetch()

or

s = GenericProperty()
s._name = 'address.zipcode'
GDSDocument.query(s == 54321).fetch()

Note that if you are querying on properties below the top level, you cannot do the more standard

GDSDocument.query(GenericProperty('address.zipcode') == 54321).fetch()  # fails

due to a limitation of ndb

If you need to get the json back from a GDSDocument, just do this:

json = lgdsDocument.to_dict()

Denormalized Object Linking

You can directly support denormalized object linking.

Say you have two entities, an Address:

{
    "key": "1234567",
    "type": "Address",
    "addr1": "1 thing st",
    "city": "stuffville",
    "zipcode": 54321
}

and a Person:

{
    "key": "897654",
    "type": "Person",
    "name": "Fred"
    "address": // put the address with key "1234567" here
}

You’d like to store the Person so the correct linked address is there; not just the key, but the values (type, addr1, city, zipcode).

If you store the Person as:

{
    "key": "897654",
    "type": "Person",
    "name": "Fred",
    "address": {"key": "1234567"}
}

then this will automatically be expanded to

{
    "key": "897654",
    "type": "Person",
    "name": "Fred",
    "address": 
    {
        "key": "1234567",
        "type": "Address",
        "addr1": "1 thing st",
        "city": "stuffville",
        "zipcode": 54321
    }
}

Furthermore, gaedocstore will update these values if you change address. So if address changes to:

{
    "key": "1234567",
    "type": "Address",
    "addr1": "2 thing st",
    "city": "somewheretown",
    "zipcode": 12345
}

then the person will automatically update to

{
    "key": "897654",
    "type": "Person",
    "name": "Fred",
    "address": 
    {
        "key": "1234567",
        "addr1": "2 thing st",
        "city": "somewheretown",
        "zipcode": 12345
    }
}

Denormalized Object Linking also supports pybOTL transform templates. gaedocstore can take a list of “name”, “transform” pairs. When a key appears like

{
    ...
    "something": { key: XXX },
    ...
}

then gaedocstore loads the key referenced. If found, it looks in its list of transform names. If it finds one, it applies that transform to the loaded object, and puts the output into the stored GDSDocument. If no transform was found, then the entire object is put into the stored GDSDocument as described above.

eg:

Say we have the transform “address” as follows:

ltransform = {
    "fulladdr": "{{.addr1}}, {{.city}} {{.zipcode}}"
}

You can store this transform against the name “address” for gaedocstore to find as follows:

GDSDocument.StorebOTLTransform("address", ltransform)

Then when Person above is stored, it’ll have its address placed inline as follows:

{
    "key": "897654",
    "type": "Person",
    "name": "Fred",
    "address": 
    {
        "key": "1234567",
        "fulladdr": "2 thing st, somewheretown 12345"
    }
}

An analogous process happens to embedded addresses whenever the Address object is updated.

You can lookup the bOTL Transform with:

ltransform = GDSDocument.GetbOTLTransform("address")

and delete it with

GDSDocument.DeletebOTLTransform("address")

Desired feature (not yet implemented): If the template itself is updated, then all objects affected by that template are also updated.

Deletion

If an object is deleted, then all denormalized links will be updated with a special key “link_missing”: True. For example, say we delete address “1234567” . Then Person will become:

{
    "key": "897654",
    "type": "Person",
    "name": "Fred",
    "address": 
    {
        "key": "1234567",
        "link_missing": True
    }
}

And if the object is recreated in the future, then that linked data will be reinstated as expected.

Similarly, if an object is saved with a link, but the linked object can’t be found, “link_missing”: True will be included as above.

updating denormalized linked data back to parents

The current version does not support this, but in a future version we may support the ability to change the denormalized information, and have it flow back to the original object. eg: you could change addr1 in address inside person, and it would fix the source address. Note this wont work when transforms are being used (you would need inverse transforms).

storing deltas

I’ve had a feature request from a friend, to have a mode that stores a version history of all changes to objects. I think it’s a great idea. I’d like a strongly parsimonious feel for the library as a whole: it should just feel like “ndb with benefits”).


gaedocstore: JSON Document Database Layer for ndb

Network X

Update: Interesting discussion of this post here: https://plus.google.com/u/0/100281903174934656260/posts/2xEYr8Yw4k9

I’m sick in bed today, floored with something viral I reckon. Glands are up, headache, the room’s spinning. Sucks man. But as often happens when I’m headachy, my brain is exploding with a new idea. This one is for a combination of the concepts of “social network” and “blog”, into a lightweight public-only improvement on both.

“Nework X” is a distributed social network using the open internet to connect its members. You set up your “Stream” like you would set up a blog – you can self host it, use someone else’s hosting service, whatever. You can post with the ease of a social network (not heavyweight like a blog). You have a stream seeing stuff from all over the net, like a social network / feed reader combo. You can follow people. The public view of your “stream” is more like a blog, just showing your own stuff.

Your identity is your stream/blog’s url. It uniquely identifies you. Your identity is confirmed, security is dealt with, just by calling back to this url and asking it to confirm your actions. Clean, straightforward.

It’s entirely public; there’s no private stuff (just like a blog).
  • You have a unique url which shows two main views, the Stream, and the Blog.
    • Stream.
      • See this when you are logged in.
      • Your posts and everyone’s posts that you follow turn up in the stream in chronological order. You can follow other users of Network X. You can follow Facebook users. You can follow Google+ users, twitter users, etc. You can follow RSS feeds. Might also follow specific blogging software types (blogger? wordpress? etc)
      • For Network X follows, and for most of the social network follows, for blog follows, you can comment on other people’s posts as you would in those networks, and the comment goes back to the right source (more on this below)
      • There is some basic filtering, so you can include/exclude sources dynamically. A really basic one is to screen out everyone’s posts except your own (which then looks like your “blog”).
      • At the top of the stream is a “Share what’s new” box, which works like G+.
        • This might have an “advanced” button which kicks it into a more full on wyziwyg/html editor like blogs have, but still inline.
        • There’s “Publish” and “Cancel” but there’s also “Save Draft”. The post might also autosave as draft. Drafts are exactly like regular posts, except only you can see them. Once you hit publish, the post is visible publicly.
      • There is an Edit button on your own posts, which puts you into inline-editing, like above, on existing posts.
      • The stream updates in real time. Think pubsubhubbub here for Network X users, web callbacks from facebook or twitter (does G+ support this yet?), dumb slow polling for stupider stuff.
    • Blog
      • For when you are not logged in, or when someone else is viewing your url.
      • Just shows your public posts (with comments). This is really for other people to come along and read your “blog”.
      • People can comment here like they would with a blog. (Auth with your network X stream, or with fb, google, twitter, etc etc)
  • Each of your public posts has its own public page, so easily shared on other networks. Stuffed with +1, like, etc etc sharing options for other networks. Also a reshare option for Network X of course.
  • You can follow anything with an RSS feed. This is read-only following, it’ll show up in your stream but you wont be able to comment or anything like that. You can click through to whatever the origin is.
  • You can follow other Network X users.
    • Your stream/blog url is your identity.
    • You paste their URL into a follow thing on your stream page. Done.
    • If you hit follow on their stream, it then asks you to paste in your stream url. Then that triggers something on your own stream page to confirm the follow?
    • Is there something more clever we can do with the browser already knowing your identity (because you’re logged in on your own stream page) so when you press follow on another person’s page, there’s no url pasting (just a confirm on your own page)? Smarter javascripty html5y people than me will know.
  • You can comment on anyone’s post that you follow. That posts the comment back to their stream. Your identity travels with the comment, in the form of your stream url. Their stream calls back to your stream to verify you actually sent the comment. If your stream says “yes”, the comment is posted.
  • You can manage who is allowed to comment on your posts. Anyone, no auth? Any Network X user with some identity info? Maybe people can also comment using facebook auth, G+ auth, etc? Probably allowing a moderation feature is a bit heavyweight, but you are free to delete comments from your own posts as you like.
  • There should be a +1/like mechanism, works same as comments for auth etc.
  • There should be a reshare mechanism, simply creates a new post with a link back to the other person’s post (wherever it originated).
  • You can block any identity from commenting. (just maintains an internal blacklist)
  • Some spam detection with auto blocking would be nice to have.
  • Integration with other social networks
    • You can see facebook, twitter, g+, etc in your stream.
    • To do this, you need to have an identity in those networks, and oauth using that, linking your network x identity (the url) to that social network identity.
    • Your normal stream/wall from fb/twitter/g+ is then integrated into your network X stream.
    • You can comment back to those networks (except G+ obviously which is read only) and it posts pack using your identity in that network.
    • You can reshare stuff out of any of these networks into your Network X blog/stream
    • Maybe you can reshare stuff from Network X or other social networks back into other social networks as well? That’d be fun!
  • Everywhere you can, you play nice with existing open internet protocols. eg: This url can be an OpenID. Use pubsubhubbub for realtime notifications. Have an rss feed. etc.

That’s all I’ve got for now. To build this would take some skilled front end javascripty goodness, but in principle the framework is actually pretty simple. Really, if you’re not trying to do the whole “social graph” thing that the facebooks of the world are doing, then this doesn’t need to be difficult!

Network X

New Blog, “AppEngine Development”

I’ve started a new professional blog, AppEngine Development. It’s going to contain high rpm propeller hat stuff for developing systems on AppEngine. The first interesting post is The Worker, presenting a job processing class.

I’ve created the blog in the new look Blogger. It’s shiny! Lightweight and easy to use, too. However, it’s a bit light on features, a bit buggy here and there, and embeds terribly into Google+ . That last point is quite bizarre; aren’t these products meant to be part of the same ecosystem? Whatever 😉

New Blog, “AppEngine Development”

AppEngine Tuning – Schlemiel, you’re fired!

Hop it, Schlemiel

This is the concluding post in the series that begins with The Amazing Story of AppEngine and the Two Orders Of Magnitude.

You’ll recall in my initial post that I detected a, well, somewhat suboptimal algorithm, where I was touching the AppEngine datastore on the order of 10^8 times per day? Liz Fong made the comment that “Schlemiel the Painter algorithms are bad”. What? Who’s Schlemiel the painter?

Well, it turns out he’s a hard worker, but not a smart one. The reference comes from a classic Joel on Software post:

Shlemiel gets a job as a street painter, painting the dotted lines down the middle of the road. On the first day he takes a can of paint out to the road and finishes 300 yards of the road. “That’s pretty good!” says his boss, “you’re a fast worker!” and pays him a kopeck.

The next day Shlemiel only gets 150 yards done. “Well, that’s not nearly as good as yesterday, but you’re still a fast worker. 150 yards is respectable,” and pays him a kopeck.

The next day Shlemiel paints 30 yards of the road. “Only 30!” shouts his boss. “That’s unacceptable! On the first day you did ten times that much work! What’s going on?”

“I can’t help it,” says Shlemiel. “Every day I get farther and farther away from the paint can!”

Is it Schlemiel or Shlemiel? Whichever it is, we need to fire them both.

Now, you’ll recall that this was all academic. AppEngine currently has no way to detect excessive datastore reads, apart from the billing info. So, I made changes to the code to give Schlemiel the flick, then we waited.

But wait no longer! Here’s the hard data.

The Hard Data

Usage Report for 2011-09-08

Resource Used Free Billable Charge
CPU Time:
$0.10/CPU hour
12.83 6.50 6.33 $0.64
Bandwidth Out:
$0.12/GByte
0.15 1.00 0.00 $0.00
Bandwidth In:
$0.10/GByte
1.32 1.00 0.32 $0.04
Stored Data:
$0.005/GByte-day
0.48 1.00 0.00 $0.00
Recipients Emailed:
$0.10/1000 Emails
0.00 2.00 0.00 $0.00
Backend Usage:
Prices
$0.00 $0.72 $0.00 $0.00
Always On:
$0.30/Day
No $0.00
Total: $0.68

Estimated Charges Under New Pricing

The charges below are estimates of what you would be paying once App Engine’s new pricing model goes live. The amounts shown below are for your information only, they are not being charged and therefore do not affect your balance.

If you would like to optmize your application to reduce your costs in the future, make sure to read our Optimization Article. If you have any additional questions or concerns, please contact us at: appengine_updated_pricing@google.com.

Frontend Instance Hour costs reflect a 50% price reduction active until November 20th, 2011.
Resource Used Free Billable Charge
Frontend Instance Hours:
$0.04/Hour
41.31 24.00 17.31 $0.70
Backend Instance Hours:
$0.08/Hour
0.00 9.00 0.00 $0.00
Datastore Storage:
$0.008/GByte-day
0.48 1.00 0.00 $0.00
Blobstore Storage:
$0.0057/GByte-day
0.00 5.00 0.00 $0.00
Datastore Writes:
$1.00/Million Ops
0.40 0.05 0.35 $0.35
Datastore Reads:
$0.70/Million Ops
2.30 0.05 2.25 $1.58
Small Datastore Operations:
$0.10/Million Ops
0.04 0.05 0.00 $0.00
Bandwidth In:
$0.10/GByte
1.32 1.00 0.32 $0.04
Bandwidth Out:
$0.15/GByte
0.15 1.00 0.00 $0.00
Emails:
$0.01/100 Messages
0.00 1.00 0.00 $0.00
XMPP Stanzas:
$0.01/1000 Stanzas
0.00 1.00 0.00 $0.00
Opened Channels:
$0.01/100 Opens
0.00 1.00 0.00 $0.00
Total*: (before clipping to daily budget) $2.67

* Note this total does not take into account the minimum per-application charge in the new pricing model.

Let me just take a moment to say

w00t!!!!!

Oh yeah. It’s w00t, because this, although being a higher number, is one I can afford. I’m out of danger territory.

Anyway, let’s look at this in a little detail. Here’s what Schlemiel was projected to cost me:

Datastore Reads:
$0.70/Million Ops
59.06 0.05 59.01 $41.31

And here’s the post-Schlemiel picture:

Datastore Reads:
$0.70/Million Ops
2.30 0.05 2.25 $1.58

That, people, is a win.

There’s still a decent cost there, $1.58/day is considerable money for a self funded pet project. So where’s that coming from?

Recall I projected there would still be a good chunk of reads being performed by the fix:

1500 * 720 = 1,008,000 datastore reads per day

That’s in the ballpark, and probably accounts for around half of this. I can totally remove this processing with a careful change to my initialization code for the offending objects, and I haven’t done so already purely in the interests of science. So maybe it’s now time to do that.

It does look like there are still a fair chunk of reads happening elsewhere, possibly another bit of algorithm iterating a thousand or so records on every 2 minute cron job run. Odds are that’s also unnecessary. I’ll worry about that later though; I’ll remove the previously mentioned processing first, see how that works out, then take it from there.

But what about Instances, I hear you cry?

Sweet, Sweet Instances

Previously on Point7: <law and order-esque Da Dum!>

If I can get the average instances to 3, I’ll be paying 4 cents X (3-1) X 24 = US$1.92/day . That’s still a chunk more than I’m currently paying, but it’s doable (as long as everything else stays lowish).  Cautious optimism!

But what did the data say?

Frontend Instance Hours:
$0.04/Hour
41.31 24.00 17.31 $0.70

Wow, that’s much better! Compare that to my old CPU bill:

CPU Time:
$0.10/CPU hour
12.83 6.50 6.33 $0.64

What did I do? I moved a couple of sliders, and spread my tasks out with a couple of lines of code. That’s pretty tough stuff. No wonder people are bitching & moaning!

I’ve got a few days of billing data now, and it’s all similar, so I’d say it’s a solid result. I actually can’t explain why this is so cheap, it doesn’t appear to match the instance data. Here’s the instance graph:

AppEngine Instances for Syyncc, 7 Days, 10 September 2011

Whatever it is, I’m happy with it.

So I’ve Got That Going For Me Which Is Nice

Not only are the instances right down to super cheap territory, I’m pretty sure I can get the datastore reads down into free territory with just a little more work. It’s all coming up Millhouse.

Just as a fun aside, this post took a little longer than I thought, due to the billing taking a while to come through. Why’d that happen? Because my credit card was maxed out (yeah, that’ll happen!), the weekly payment for AppEngine couldn’t be processed, and so my billing info was frozen until I fixed it. It turns out they give you no more billing info, and don’t let you change your billing settings, until you pay for the thing. Oh the humanity! Well, at least your app doesn’t get turned off, that’s great. Could be a gotcha if you have your billing settings cranked up though!

I’d love an ability to throw a bunch of money in ahead of time, ie: be able to have a positive account that the weekly billing draws from (my credit card is notoriously unreliable). I guess I could implement that by getting a debit card purely for the app. But then I have to think about money and stuff, and that’s boring and awful 😉

What’s it all mean for AppEngine developers?

Straightforwardly, it means this: optimisation isn’t difficult, and you should quit whining and do it. You might learn something.

I know there are some people who are optimised and can’t fix this. Their apps are predicated on using more instances than is financially viable. That’s hard luck.

On the other hand, the vast majority of apps will just be running fat & happy, and can be fixed with a bit of attention. Just do it, it’s not that tough. In fact, if you want a hand, yell out, I’m happy to look at stuff (as long as you’re ok for me to talk about it publicly, anonymity can be preserved to protect the guilty).

I’m a huge fan of not prematurely optimising, absolutely. But premature wont last forever. Here’s my new rule of thumb for AppEngine development:

You get to be willfully stupid or cheap but not both

Bullheaded idiocy is reserved for the rich. The rest of us need to use our brains just a little bit. And then it can be super cheap. So we little guys get a platform which can have longevity, and we get our way paid by wealthy and/or dumb people. I’m good with that.

Where to next?

This comment just in on the original “Amazing Story” post:

My app has the exact same scenario as yours – I initiate ~250 URL Fetches every 15 minutes. If I allow multiple front-end instances to get created, all these fetches will occur in parallel, but I’d be paying a lot of money for all these mostly idle instances. My optimization centers around using one single backend that processes these URL fetches one at a time (totally acceptable for my app), by leasing them one at time from a pull queue. The pull queue is populated by random events in a front-end instances, and the back-end is triggered by a cron every 15 minutes to lease these URL Fetch tasks from the pull-queue. This way all my work gets done by a single backend that runs 24×7. I could easily change my cron to run once every hour instead of 15 minutes, and then my backend is running for free (just under 9 instance hours a day).

Another level of optimization is kicking off multiple URL Fetches using create_rpc() calls, so that my backend can do other things while the URL fetch completes (which, like in your case, can take several seconds to complete or timeout). With all this, I hope to stay under the free instance hour quota.

Some people, unlike me, can just say something awesome in a couple of paragraphs without going all tl;dr on it.

Firstly, Rishi has done the backend style optimisation which seemed like the way to go. And what’s that you’re saying, it could run for free? Now you’ve got my attention. That’s worth some thought.

Secondly, what’s this create_rpc() call of which Rishi speaks? Oh, it must be this:

http://code.google.com/appengine/docs/python/urlfetch/asynchronousrequests.html

I really should RTFM, OMFG!

“Asynchronous Requests: A Python app can make an asynchronous request to the URL Fetch service to fetch a URL in the background, while the application code does other things.”

The doco says that you create an rpc object using create_rpc(), then execute it with make_fetch_call(), then finally wait for it to complete with wait() or get_result(). You can have it call a callback function on completion, too (although it requires the call to wait() or get_result() to invoke it).

My code is full of long fetches to external urls. It might be possible to do other things while they execute, with a code restructure. I smell some coding and another blog post in my future.

AppEngine Tuning – Schlemiel, you’re fired!

AppEngine Tuning – An instance of success?

Previous related posts: https://point7.wordpress.com/2011/09/03/the-amazing-story-of-appengine-and-the-two-orders-of-magnitude/ and https://point7.wordpress.com/2011/09/04/appengine-tuning-1/

As I’ve detailed in the previous posts, I’m facing a big Google AppEngine bill for Syyncc, based on the number of running instances. Lots of small developers like me have been struggling with this (and bellowing) but I’m betting that this is in my control, and due to poor suboptimal coding on my part.

In my last attempt at tuning, I managed to drop the average running instances from over 10 to around 5 or 6. Can I do better?

I already identified a likely culprit for the excess instances, which is that I’m kicking off 50 tasks, all at once, every 2 minutes. That kind of spiky load must force the scheduler to keep more instances running than really necessary. It’s more than necessary because I want the tasks done within the 2 minute period, but I don’t care about latency within that.

Now, these tasks are calls to /ssprocessmonitor,  which the original post showed as averaging a bit over a second run time. The longest run time I’ve been able to see by checking my logs is about 4 seconds.

If I were to do these processes in a bit of sequential processing (in a backend?) then they’d finish before the two minutes were up, more or less. But I don’t want to go so far as to rearchitect around that. Can I do something simpler?

Here’s the code that wants optimising, from /socialsyncprocessing2 :

monitors = SSMonitorBase.GetAllOverdueMonitors(50, 0)
if monitors:
    for monitor in monitors:
        logging.debug("Enqueuing task for monitor=%s" % (monitor.key()))
        # See SSMonitorProcessor.py for ssprocessmonitor handler
        taskqueue.add(
            url='/ssprocessmonitor',
            params={'key': monitor.key()}
        )

The problem here is that the tasks are being added to the taskqueue all at once. Wouldn’t it be nice if there were a simple way to stagger them, spread them out through the 2 minutes? Let’s look at the doco:

http://code.google.com/appengine/docs/python/taskqueue/tasks.html

Here’s a nice little morsel, an optional parameter in taskqueue.add() :

countdown: Minimum time to wait before executing this task, in seconds. Defaults to zero.

Using that, I could spread the tasks out, 2 seconds apart. That means the last one would at best begin 100 seconds after the tasks were scheduled, which still gives it (and any straggling tasks) 20 seconds to complete before this whole process starts again.

So, here’s the modified code:

monitors = SSMonitorBase.GetAllOverdueMonitors(50, 0)
if monitors:
    lcountdown = 0
    for monitor in monitors:
        logging.debug("Enqueuing task for monitor=%s" % (monitor.key()))
        # See SSMonitorProcessor.py for ssprocessmonitor handler
        taskqueue.add(
            url='/ssprocessmonitor', 
            params={'key': monitor.key()}, 
            countdown=lcountdown
        )
        lcountdown += 2

There are a lot of better ways to be doing what I’m doing here, but this might at least get me out of a jam.

So how did it go? Here’s the instances graph, see if you can spot where I uploaded the new code:

Instances Graph for Syyncc, 6 September 2011

Is this success? It’s better, a bit up and down. Maybe I need more time to see how it behaves.

Here’s a the view over a four days, so you can see it back when it was really bad, the previous optimisation, then this one.

4 day Instances Graph for Syyncc, 6 September 2011

I’m feeling better about that.

What I’m going to be billed under the new system is:

  • 4 cents / instance hour, less 1 free hour per hour.

So that’s the area under the graph, minus a 1 unit high horizontal strip, times 4 cents.

If I can get the average instances to 3, I’ll be paying 4 cents X (3-1) X 24 = US$1.92/day . That’s still a chunk more than I’m currently paying, but it’s doable (as long as everything else stays lowish).  Cautious optimism!

Now that’s all great, but there’s something else that I might have been able to use, and without a code change.

Apparently, push queues (ie: what I’m using) can be configured:

You can define any number of individual queues by providing a queue name. You can control the rate at which tasks are processed in each queue by defining other directives, such as ratebucket_size, and max_concurrent_requests. You can read more about these directives in the Queue Definitions section.

The task queue uses token buckets to control the rate of task execution. Each named queue has a token bucket that holds a certain number of tokens, defined by the bucket_size directive. Each time your application executes a task, it uses a token. Your app continues processing tasks in the queue until the queue’s bucket runs out of tokens. App Engine refills the bucket with new tokens continuously based on the rate that you specified for the queue.

(from http://code.google.com/appengine/docs/python/config/queue.html#Defining_Push_Queues_and_Processing_Rates )

So I could have defined a small bucket_size, and a low rate. Can you have a fractional rate? If so, the code changes above could be reverted, and instead I could add this to queue.yaml:

queue:
- name: default
  rate: 0.5/s
  bucket_size: 1

I’ll keep that up my sleeve. I’ve already made the code change above, so I may as well let it run for a bit, see how it performs.

Update: Here’s the graph from the next morning. It’s full of win!

AppEngine Instances for Syyncc, 7 September 2011
AppEngine Tuning – An instance of success?

AppEngine Tuning #1

Following my article The Amazing Story Of AppEngine And The Two Orders Of Magnitude, I’ve made some initial adjustments to Syyncc ‘s performance settings, and a minor code tweak.

Instances

I made the following change to Syyncc’s performance settings today:

AppEngine Performance Settings for Syyncc, 4 September 2011

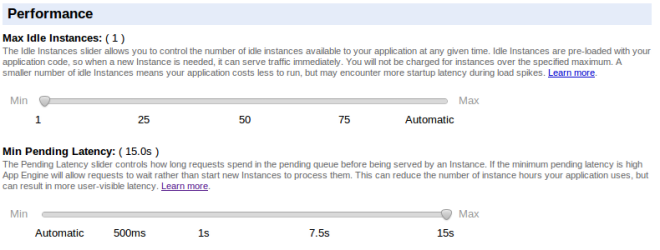
I’ve set the Max Idle Instances to 1, and Min Pending Latency to 15 seconds. ie: hang it all, don’t start more instances unless the sky is falling in.

Syyncc’s site still seems responsive enough, and the app itself is working as before, I can’t detect any functional difference. But what’s important is that the average instance count has dropped significantly:

Instances Graph for Syyncc, 4 Sep 2011

It’s dropped to 4 or 5 instances average, rather than 10 to 15 that it’s normally at. Not bad for shoving a couple of sliders around! And that’s without what will be necessary code changes, to stop the behaviour where the 50 tasks are scheduled concurrently once every 2 mins. That leads to a spike in activity, then nothing for most of the time, and is very likely the cause of excess idle instances. That’s all detailed in the previous post, linked at the top.

Given that the impact from the performance tuning is obvious, I’ll go ahead with refactoring the bursty scheduling code in the next few days, and post the results of that.

A bit more detail:

Instances Detail for Syyncc, 4 September 2011

Not quite good enough (I want to get down to under 2 average), but much better.

Datastore Reads

You’ll recall from the previous article I had the horrible code full of fetches with offsets. I’ve replaced it with this:

    def SetAllNextChecks(cls):
        monitor_query = SSMonitorBase.all().filter("enabled", True)
        lopcount = 0
        for monitor in monitor_query:
            if not monitor.nextcheck:
                monitor.nextcheck = datetime.today() - timedelta(days=5)
                monitor.put()
            lopcount += 1
        logging.debug("SetAllNextChecks processed %s monitors" % lopcount)
    SetAllNextChecks = classmethod(SetAllNextChecks)

So that’s a simple iteration through the query that should behave much better; the debug line says

D2011-09-04 23:19:24.189 SetAllNextChecks processed 1403 monitors

and I’m fairly sure that this is actually accurate (ie: it’s not actually touching over 100,000 objects!)

There’s no way to tell if it’s helping at the moment, Datastore Reads are only surfaced in the billing, and the billing lags a few days behind. So, I’ll report back midweek or so with results of this change.

It’s a start

That’s it for now. Some preliminary success, but I’ve got a way to go. Stay tuned for the next update in a few days.

AppEngine Tuning #1

The Amazing Story Of AppEngine And The Two Orders Of Magnitude

(Update: This post is continued in Tuning #1, An Instance of Success, and Schlemiel, You’re Fired!)

In my last post, I talked about my use of AppEngine, my boosting of AppEngine as a business platform, and some of the changes as it leaves preview. But I left out the big change, the changes to pricing.

Beat Me With Your Billing Stick

The price changes were announced a few months ago, and I remember an outcry then. I just ignored it, I figured that hey, it wont be so bad, my app doesn’t do much, it’ll be cool. But now Google has released a comparison tool in the AppEngine billing history page, so you can see what you would be billed right now if the new system was already in place.

Here’s the output of my billing comparison for Syyncc, for 1 day:

2011-09-01 12:31:11 Usage Report for 2011-08-29 $0.51
Resource Used Free Billable Charge
CPU Time:
$0.10/CPU hour
11.39 6.50 4.89 $0.49
Bandwidth Out:
$0.12/GByte
0.13 1.00 0.00 $0.00
Bandwidth In:
$0.10/GByte
1.17 1.00 0.17 $0.02
Stored Data:
$0.005/GByte-day
0.44 1.00 0.00 $0.00
Recipients Emailed:
$0.10/1000 Emails
0.00 2.00 0.00 $0.00
Backend Usage:
Prices
$0.00 $0.72 $0.00 $0.00
Always On:
$0.30/Day
No $0.00
Total: $0.51

Estimated Charges Under New Pricing

The charges below are estimates of what you would be paying once App Engine’s new pricing model goes live. The amounts shown below are for your information only, they are not being charged and therefore do not affect your balance.

If you would like to optmize your application to reduce your costs in the future, make sure to read our Optimization Article. If you have any additional questions or concerns, please contact us at: appengine_updated_pricing@google.com.

Frontend Instance Hour costs reflect a 50% price reduction active until November 20th, 2011.
Resource Used Free Billable Charge
Frontend Instance Hours:
$0.04/Hour
231.13 24.00 207.13 $8.29
Backend Instance Hours:
$0.08/Hour
0.00 9.00 0.00 $0.00
Datastore Storage:
$0.008/GByte-day
0.44 1.00 0.00 $0.00
Blobstore Storage:
$0.0057/GByte-day
0.00 5.00 0.00 $0.00
Datastore Writes:
$1.00/Million Ops
0.35 0.05 0.30 $0.30
Datastore Reads:
$0.70/Million Ops
59.06 0.05 59.01 $41.31
Small Datastore Operations:
$0.10/Million Ops
0.04 0.05 0.00 $0.00
Bandwidth In:
$0.10/GByte
1.17 1.00 0.17 $0.02
Bandwidth Out:
$0.15/GByte
0.13 1.00 0.00 $0.00
Emails:
$0.01/100 Messages
0.00 1.00 0.00 $0.00
XMPP Stanzas:
$0.01/1000 Stanzas
0.00 1.00 0.00 $0.00
Opened Channels:
$0.01/100 Opens
0.00 1.00 0.00 $0.00
Total*: (before clipping to daily budget) $49.92

* Note this total does not take into account the minimum per-application charge in the new pricing model.

So what’s the take home message here?

Old price for one day: $0.51
New price for one day: $49.92

ie: my pricing has increased by two orders of magnitude.

And, that’s a pretty cheap day. Many other days I looked at were over $60 under the new scheme.

So, instead of being in the vicinity of $200/year, I’m looking at $20,000/year.

Is it time to panic?

Not just yet. You see, there’s some interesting stuff in those numbers.

Firstly, most stuff has stayed the same. The bandwidth costs have stayed negligible. There are lots of zeroes where there were zeroes before.

In fact there are only two numbers of concern. Admitedly they are *very* worrying, but still, only two.

Frontend Instance Hours

This is one I was expecting, one that’s been getting a lot of press. Google AppEngine has removed CPU based billing and replaced it with Instance based billing. CPU based billing meant you only paid while your app was doing work. Instance based billing means you pay for work your app does, and time that the app is waiting for something to happen, and for the amount of idle capacity being held ready in reserve for your app.

It turns out that my app was using 11.39 CPU Hours per day, and 231.13 Instance hours per day. So that change is somewhat bad for me!

Here’s a picture:

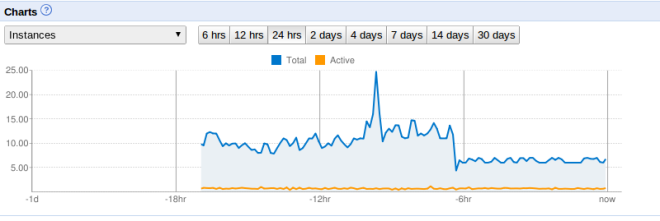
AppEngine Instance Usage for Syyncc for 2 September 2011

The orange line is active instances (ie: actually in use). The blue line is total instances (ie: adding in idle instances waiting around to do something). While the total instances seems to average somewhere between 10 and 15 at any time, the active instances looks to average less than 1. ie: there’s a lot of wasted capacity.

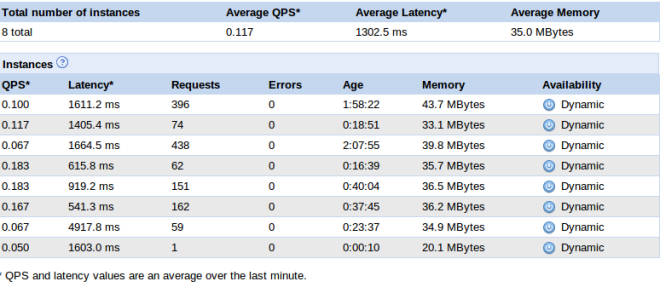
Here’s some more detail, from the AppEngine console’s Instances page:

Detailed Instance Data for Syyncc for 3 Sep 2011

From this page I can see Syyncc is servicing roughly one query per second. That’s like one person hitting a web page per second. A decent load, but not a killer. However, those instances are serious overkill for a load like that!

Where does all that load come from? Let’s look at the current load:

GAE Current Load for Syyncc, 3 Sep 2011

I was worried that the Rudimentary Google+ API that I put up a little while back was causing the load, but looking at this, it’s not a big deal (it’s /gpapi). The real requests are from /ssprocessmonitor (a piece of Syyncc’s monitoring of social networks which evidently runs every 2 seconds at the moment, for over a second per run), and socialsyncprocessing2, the “main loop” of syyncc which kicks off all other tasks, which runs as a cron job once every 2 mins, but runs for over 20 seconds at a time! Also, /ssweb-fbevents is worth a look, running on average over once per minute; its job is to receive incoming notifications from Facebook that a user has made a new post or comment. It’s not too bad though.

This fairly clearly tells me what’s using the most CPU time, but it’s not clear to me what is causing such a high amount of idle instances to stay running.

I guess the question really is, what is an instance? A good place to start is http://code.google.com/appengine/docs/adminconsole/instances.html . Its sort of informative, although a little brief in truth. Incidentally, this:

“This scaling helps ensure that all of your application’s current instances are being used to optimal efficiency and cost effectiveness.”

made me say “orly???”

Anyway, the gist seems to be that more instances start when tasks (ie: some kind of request to a url resource) seem to be waiting too long in existing instance queues. So the key to me bringing the instance cost down is to figure out how to reduce that wait time, I guess. Or, maybe there’s some more direct control I can take of the instance management?

Reading the google doco on this, http://code.google.com/appengine/docs/adminconsole/performancesettings.html, there are indeed two settings I can use. Firstly,  I can set “Maximum number of idle instances”, which stops the app using more than this number of idle instances in anticipation of future work. It looks to me like I could set that to 1 or 2, and that would be a vast improvement on, say, 10 which the default “automatic” settings seems to be deciding on. Secondly, Minimum Pending Latency (which seems to be what causes the infrastructure to claim more instances) could be a lot higher. Remember that most of Syync’s load comes from itself, not from external users. So, being less responsive should be totally acceptable (no one can see that anyway). So, huge potential here, for cutting the cost down without a single code change.

If code changes are needed, perhaps I could write Syyncc to kick off less parallel tasks? Looking at this code in /socialsyncprocessing2 which runs every 2 mins:

        monitors = SSMonitorBase.GetAllOverdueMonitors(50, 0)
        if monitors:
            for monitor in monitors:
                logging.debug("Enqueuing task for monitor=%s" % (monitor.key()))
                # See SSMonitorProcessor.py for ssprocessmonitor handler
                taskqueue.add(url='/ssprocessmonitor', params={'key': monitor.key()}) 

What’s that doing? Well, it’s grabbing 50 monitors (ie: things that monitor one social network for one user) that are overdue to be checked, and it’s scheduling an AppEngine task to check each of them (that’s what /ssprocessmonitor does). There’s something bad about this loop in that it instrinsically doesn’t scale (once there are too many users to handle with 50 checks/2 seconds, syyncc will slow down).

But what’s worse, is that once every 2 mins, Syyncc says to AppEngine “Here, quick, do these 50 things RIGHT NOW”. AppEngine’s default rules are all around being a webserver, so it’s saying, crucially, if any tasks have to wait too long (ie: their pending latency gets too high), then kick off another instance to help service them. How long is the “automatic” minimum pending latency? I don’t know, but it can’t be much more than a second or two, going on the latency settings in my instances data.

So AppEngine kicks off an new instance, then another, but there are still heaps of tasks waiting, waiting! Oh no! Kick off more! And I’m guessing for syync it hits the 10 to 15 instances mark before it gets through all those tasks. Phew!

And then, nothing happens for another minute or so. Meanwhile, all those instances just sit there. It probably starts thinking about timing them out, shutting them down, when /ssprocessmonitor runs again and says “Here, quick, do these 50 things RIGHT NOW” again! And so on. And so the very high number of idle instances.

So changing my code to not schedule a batch of concurrent work every couple of minutes would be a good thing!

Long story short here, I’ve got options. I can probably fix this instances issue. I’ll try some stuff, and blog about the results. Stay tuned.

Meanwhile, there’s a much, much bigger issue:

Datastore Reads

What’s a datastore read? It seems to mean any time you touch, or cause AppEngine to touch, an object in the apps’ datastore. Mundane stuff. But let’s look at what the new billing scheme says:

Datastore Reads:
$0.70/Million Ops
59.06 0.05 59.01 $41.31

The first three numbers are Used, Free and Billable, in units of millions of ops, and the last is the price (Billable * $0.70/Million Ops). Per day. Ouch!

Now this never used to be part of the quota, and in fact I know of no other way to even know your stats here except for the new billing tool. So, it’s a total surprise, and it’s very difficult to find out much about it.

First up, reality check: My app is doing something in the vicinity of 60 Million operations on the datastore per day. REALLY!!??!?!?! But actually, it’s probably true.

Let’s think about Syyncc’s datastore. There are a bunch of different entity types in there, some with around 3000 entities in them. And then, there is SSItemMark.

SSItemMark Stats for Syyncc, 3 Sep 2011

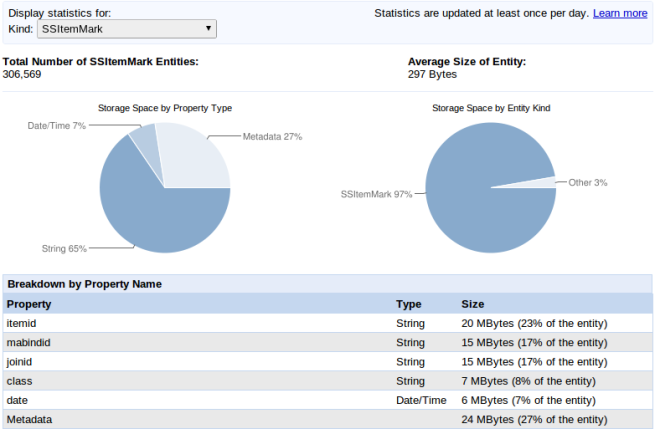
An Item Mark (which is what SSItemMark entities are) is a relationship between one post in one social network (say Facebook) and another in another network (Google+), or between a comment in one network and a comment in another. When Syyncc cross-posts or cross-comments, it saves an Item Mark to link the original post/comment and the new one Syyncc has created. If you have 3 networks set up, Syyncc creates 2 marks, if you have 4, Syyncc creates 3 marks.

Syyncc has no method of deleting old marks, I’ve never bothered with it. I’m below the paid quota for storage, and it just hasn’t mattered till now, why not just hang onto them?

So, there are currently over 300,000 of them, as is shown above.

But 300,000 is a lot less than 60,000,000. What’s the deal?

Maybe something I’m doing with my queries is touching a goodly subset of these objects every time I do a query. It could be something in /ssprocessmonitor, which is happening once every couple of seconds. If that were true, we’d have:

(K1 * 300,000) objects touched * K2 queries / 2 seconds * 60 sec/min * 60 min/hr * 24 hr/day =  K1 * K2 * 12,960,000,000 objects touched per day.

Say there’s only one query responsible, so K2 == 1, then K1 is approx 0.0046

ie: I only have to be touching a small subset of those records every couple of seconds for things to get crazily out of control.

OTOH, inspecting the code, it doesn’t look like this is the case. I use fetches on the Item Marks, but they should only ever return 1 object at a time, and I never iterate them. It’s possible that my use of fetches behaves differently to what I expect, but I don’t think so. I don’t think SSItemMark is causing this issue.

Let’s look at the fetch() call, because this is the one that’s got the potential to be the culprit. I use them extensively to get data, and it turns out there’s a big gotcha!

http://code.google.com/appengine/docs/python/datastore/queryclass.html#Query_fetch

fetch(limit, offset=0) Executes the query, then returns the results. The limit and offset arguments control how many results are fetched from the datastore, and how many are returned by the fetch() method:

  • The datastore fetches offset + limit results to the application. The first offset results are not skipped by the datastore itself.
  • The fetch() method skips the first offset results, then returns the rest (limit results).
  • The query has performance characteristics that correspond linearly with the offset amount plus the limit.

Arguments:

limit

  • The number of results to return. Fewer than limit results may be returned if not enough results are available that meet the criteria.

limit is a required argument. To get every result from a query when the number of results is unknown, use the Query object as an iterable instead of using the fetch() method.

offset

  • The number of results to skip.

config

The return value is a list of model instances or keys, possibly an empty list.

So, paging through records using limit and offset is incredibly prone to blowing out the number of datastore reads; the offset doesn’t mean you start somewhere in the list, it means you skip (ie: visit and ignore) every object before reaching the offset. It’s easy to see how this could lead to the 60,000,000 data store reads/day that I’m experiencing.

Another look at the code for /socialsyncprocessing2 gives this:

class SocialSyncProcessingHandler2(webapp.RequestHandler):
    def get(self):
        # any records with a null nextcheck are given one making them overdue
        SSMonitorBase.SetAllNextChecks()
        # ... and the rest ...

The way /socialsyncprocessing2 works, as we saw in the previous section, is to get up to 50 overdue monitors and process them. We know they’re overdue because there is a NextCheck field that has a date in it signifying when the monitor next needs checking. But sometimes, especially for new signups, the NextCheck is not set. So, I threw in  SetAllNextChecks() to make sure there’s a value in all the monitors before they are checked. Wait, it checks all of them? Let’s look at that code:

    def SetAllNextChecks(cls):
        monitor_query = SSMonitorBase.all().filter("enabled", True)

        offset = 0
        monitors = monitor_query.fetch(10, offset)
        while monitors and (len(monitors) > 0):
            for monitor in monitors:
                if not monitor.nextcheck:
                    monitor.nextcheck = datetime.today() - timedelta(days=5)
                    monitor.put()
            offset += len(monitors)
            monitors = monitor_query.fetch(10, offset)
    SetAllNextChecks = classmethod(SetAllNextChecks)

There are about 1500 SSMonitorBase objects (ie: monitors). Most of these are enabled, let’s just assume they all are for now. The code above loops through them all, and any without a NextCheck set get a date in the past plugged in (which makes them overdue).

Ok, fine. Except, look at that evil loop. It uses fetch() to get 10 objects at a time, processes 10, then gets 10 more, until it gets through all 1500. And it does that by using amount and offset.

So, looking at the doco above, the loop will touch the first 10 objects. Then it’ll touch the first 10 again to get to the next 10 (so 20). Then it’ll touch the first 20 again to get to the 10 after that (that’s 30 more), and so on all the way to 1500. If the amount was 1 instead of 10, the formula N * (N-1) / 2 would give the number of accesses. With amount 10, it’s approx N * (N-1) / 20 .

1500 x (1500 -1) / 20 = 112425 datastore reads

Ok. That seems, you know, excessive.

Now consider that this happens every 2 minutes. That is, 30 times per hour, or 720 times per day.

112425 * 720 = 80,946,000 datastore reads per day.

Now that’s a few too many (what’s 20 million reads between friends?) but if we assume some of the monitors are not enabled, that’ll be dead on. It’s got to be the culprit.

That also tells me that it’s unlikely that anything else is doing excessive reading. This should account for the entire issue. Good news, no?

Now if I were to rewrite the above to just iterate on the query, and not use fetches, the number would be:

1500 * 720 = 1,008,000 datastore reads per day

which would be about 70 cents per day. Even better, it’d be an O(N) operation instead of O(N^2), so it’s not going to get wildly out of hand.

But even better than that, if I were to fix the rest of the code (particularly new user signup) so that this field is never None, I could dispense with this operation altogether. That’s the best solution, because frankly this operation is total crap. I could run it as a backstop once per day, maybe, but really I shouldn’t need it.

Wow, Solved?

Well, maybe. It’s looking good, isn’t it? If I can limit the number of idle instances to something really low, and if I can get rid of the expensive and wasteful SetAllNextChecks(), the billing should come all the way back down to where it is now. w00t!

But, I can’t be sure of that. I’ll go do it, and report back. Thanks for reading, and tune in next time to see how it goes…

The Amazing Story Of AppEngine And The Two Orders Of Magnitude

Syyncc, AppEngine and Me

Angry Squid logo by Andrew Rose of Tamale Creative

I haven’t written much on my blog about my main personal software project, Syyncc. Syyncc, an AppEngine app, is my service for crossing posts and comments automatically between multiple social networks (originally Facebook, Buzz, now one way support for Google+ which will be full support when the API is released, and crappy broken support for WordPress, which I really must sort out).

(btw, Syyncc is in the process of getting a branding facelift, and becoming Angry Squid. But that’s for another post).

I built Syyncc to solve my own problem with social networks, which was that I felt stuck inside one network at a time. To use more than one network, you have to post across them all, then you have fragmented conversations, each in its own silo. Syyncc fixes this, by monitoring all your networks, moving public posts from one to all the others, then moving all comments made on that post, in whatever network, to all the other networks.

It’s a cool technology that I just built for myself. However, as soon as it existed, other people started asking me “how are you doing that, can I do that?” So I opened it up for anyone to use, sort of went into production by accident, and since then I’ve been on this crazy rollercoaster, dealing with a system with hundreds of users, and everything that goes with that.

Now I’m funding this out of my own pocket, and I’m pretty cheap. So very early on (really before Syyncc in fact), I spotted Google’s AppEngine; a high level Platform-as-a-service (PAAS), which I could use for free (as long as I stayed under the free quotas). I started teaching myself how to use the platform, and immediately had the idea of using it as a platform for monitoring other systems, and moving information around; the first thing I built was an RSS/Atom to Email service (which is hosted at http://www.productx.net), which I use for my newsfeeds. I’ve never been a Google Reader user, but I’m a gmailaholic, so this is still how I read newsfeeds. That service incidentally has some interesting stuff to it; terrible web design (apologies for the clouds!) but a model where you don’t need to log in in any way, the whole authentication mechanism is based on emails. Quite a few people use it (I’m not sure how many, it’s not really instrumented).

Anyway, ah yes, AppEngine. I’ve been amazed by the excellence of AppEngine. When I first saw it, I thought it was an incredibly compelling platform for small to medium enterprise development. Sure, there’s lock-in, and there was no guarantee that Google wouldn’t just shut it down (it was in “preview” status after all). But, it offered such an incredible effort multiplier (by providing all this high level, scalable platform that you don’t have to build or install or administrate yourself), that it was probably worth the risk, and then some.

And now with coming up on a couple of years experience with it, I’m satisfied that it’s a solid platform, a reliable platform. It’s been working spectacularly well for Syyncc, with very little down time (and certainly orders of magnitude less than I would have experienced if I were running my own equipment, because I’m a shitty admin, just like everyone else who isn’t a professional systems administrator). In fact, I’m convinced that Syyncc wouldn’t exist if I’d had the extra burden and cost of running my own equipment; I just wouldn’t have gotten it off the ground.

So I’ve been boosting it as a platform. I believe the experience for small companies moving from their own infrastructure (eg: LAMP on Linux, or IIS/.net on Windows), to AppEngine, will be like that of moving from hosting their own email to using gmail. You get to shed a bunch of worries and expense (machines, people supporting servers, infrastructural concerns) and get a much more dependable platform. You might lose service for a few hours a couple of times a year, but, in email, you’re comparing that to the average SME experience of running MS Exchange, which is that you have problems maybe every couple of weeks, email always seems to be going down, people lose email, people can’t get email remotely, etc etc etc. In developing and running bespoke web apps, you’re comparing maybe losing service for a few hours a few times a year, to the common experience of having running infrastructural issues causing outages on an ongoing basis (reboot the server!), file permission issues, issues with backups, hassle and expense and flakiness and the occasional catastrophic screw up (“um did I really just type “rm -rf *” ??” ) that kills you for days or even weeks.

The most recent example of this is that, in my new job at Ecampus, I’ve pushed for us to use AppEngine for new development. The company is about to begin building a lot of new interesting online apps, with an experimental element to a lot of the work, certainly with a need to be agile, and respond to changes in the company’s business direction as they emerge. I believe AppEngine is the best platform available to support the kind of rapid, agile work that we’ll be doing, so we’re jumping boots-first into it.

Now obviously this has been a scary path to take. Particularly, there have been no guarantees about the longevity of the platform. However, at Google I/O this year they announced that AppEngine would shortly be leaving preview status, and would gain some critical new guarantees – particularly a 99.95% uptime, and a 3 year deprecation policy. Which has now happened.

Since that announcement there’s been a surge of interest regarding business use of AppEngine. It’s suddenly something you can invest real time and money in. I’m not reading much about it, but I’m noticing personal contacts starting to talk about it in a business context, asking questions about viability. It’s on the map.

But something else has changed, and that’s the price. And it’s no small change.

But read more about that in my next post, “The Amazing Story Of Appengine And The Two Orders Of Magnitude”.

Syyncc, AppEngine and Me

Protip for Buzzers: Move to Google+, but keep your Buzz

Link Google+ to Buzz with Syyncc

I’ve been active on Buzz since it was introduced in early 2010. That’s right, I’m old-school! And since it came out, the quickly very cohesive and high quality Buzz community has been looking for some love from Google for its red headed stepchild.

We were scorned. We were pilloried.

And then?

The Rapture!
The Rapture!

We fled out of Buzz and into Buzz 2.0 Google+ like the chosen tribe of a loving deity. For a while there was consternation, especially from those Left Behind, but that sorted itself out over a few days.

And now, many people put up “last posts”, like this one:

I have moved

And Buzz has gotten a little quiet…

But, it’s not dead yet. People are still posting, chatting, it’s still a good place to be. We don’t have to abandon it!

Now I’m sure that Google will eventually lift the whole lot into Google+ and shut down the Buzz brand. But in the meantime, it’s drastic to burn our bridges when there’s a better way.

If you’d like to move to G+, but keep your Buzz presence alive, try my app Syyncc. It allows you to sync up posts between Facebook, Buzz and WordPress, and now it has one way support for Google+; that is, it can copy public posts & comments out of Google+ and into, say, Buzz!

Just sign in with your Buzz/Google+ profile, set up Buzz (authorise it to work with Buzz, no credentials required), and then turn on Google+. Voila, it’ll start working immediately.

What it’ll do, is quietly sit in the background monitoring Google+ for posts, and comments on those posts, and copy them to Buzz for you. So you never have to think about it again, just go use Google+ and let Syyncc do the crossposting work for you.

(In the future, when Google releases the proper API for Google+, I’ll modify Syyncc so that posts can go into Google+ as well as coming out. )

Protip for Buzzers: Move to Google+, but keep your Buzz